Updated Analysis of Our Patients: What it Means for You
Patty Scheets, Vice President of Quality and Compliance
Quick Summary
- We updated analytics of PT and OT data.
- There are small changes in the proportion of each of our patient types:
- more Type 2 and 4
- fewer Type 1 and 6
- The value of our care IMPROVED for Type 4 patients! This is great news!
- There is opportunity to improve what we are doing:
- Use Intensity pillar earlier and more consistently for Type 2 patients to improve discharge status.
- Focus on Wellness & Prevention pillar earlier and more completely for Type 6 patients. Establish compensatory and adaptive strategies for evaluation status, start caregiver training very early, and anticipate discharge to a higher level of care.
As you are all aware, here at Infinity Rehab, we have a standardized data collection process with the goal of having a comprehensive, standardized, objective, picture of each patient. These data are used at the individual patient level to understand current status, measure change over time, compare status to published normal values, benchmark current status against critical health-related thresholds, and to communicate with each other and other stakeholders including the patients themselves, families, and the inter-professional team. The systematic collection of these data are a foundational practice in our commitment to best evidence care.
In addition to using these data in managing individual patients, we have a robust data analytics process which allows us to learn from the group of patients. We then take what we learn from the group of patients to inform and guide our practice of current and future patients. These steps illustrate our commitment to ongoing performance improvement and consistently bringing our very best to each patient.
We recently updated the analytics of our data set which is standard practice for this type of work. We do this so that the data set we are using in our clinical decision-making support tools are reflective of the patients we are seeing now and in the near future. It’s been especially important to complete now because of the changes in our reimbursement structure under PDPM (October 2019) and, of course, our experience with the COVID-19 pandemic.
In this article, I’d like to provide a summary of our most recent findings and suggestions for how to use this information in everyday practice. Our current database does not yet include measures collected by our speech-language pathologists, so what is provided here applies to occupational and physical therapy.
Patient Groups
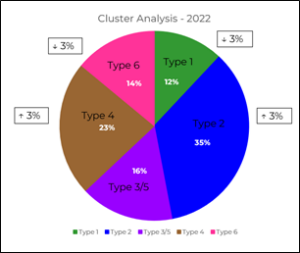
As in previous analyses, we identified five distinct clusters in our data set, and these relate to the patient types we use in OT and PT. In the figure below, you can see that the proportion of these patient types in this updated analysis with the change in proportion from the previous analysis indicated in a box.
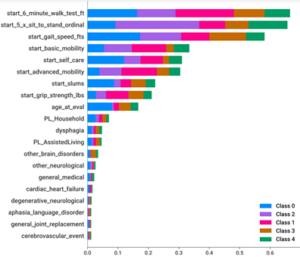
 This type of data analysis yields a list of features that are important in distinguishing one group from the other in order of their importance. In the figure to the left, you can see the visualization of this feature impact list. The length of the bar next to each variable reflects the importance of that feature in group assignment. Interestingly, you can see that the most important variables impacting group assignment is the initial 6-minute walk test (6MWT), initial ordinal score of repeated chair stands (5XSTS), and initial walking speed. These are the same top three features we saw in our previous analysis, but the order of 6MWT and 5XSTS are switched.
Value of Care Delivered is Improving
In previous editions of the Insider, we have talked about the overarching goal within healthcare of improving the value of care delivered. This has been defined by the following equation[1]:
VALUE = OUTCOME
         COST
At Infinity Rehab, we have adopted this definition of value and represented it by what we call the Rate of Change Index (RCI). The RCI is calculated for each of our standardized outcome measures with the change value in the numerator of the equation, and the total OT and PT hours of care in the denominator.
In previous analyses, we have struggled with delivering a consistent value across all patient types. This most recent analysis, however, illustrates that our efforts toward improving value are working! We are seeing this improvement in our Type 4 patients. As a refresher, these are individuals who have goals for standing/walking but in a very limited capacity. While more than half of these patients go home, they do so with caregiver support and have very limited capacity for community activities. The RCI values for these patients in this analysis have improved, and, it appears, this is happening because they are making more change during their stay and because we have lowered the total amount of care they receive. Clinically, this is the very best way to improve value of care provided and is very exciting news. These data demonstrate that we are aligned with the PDPM reimbursement model and the overall direction of the healthcare system.
Opportunities for Performance Improvement
When we study the data, we can see two areas of opportunity in how we manage our patients.
- Increasing discharge performance for Type 2 patients.
From the first figure, you can see that this is the single largest group of our patients (35%). While most of these patients do go home (86%), they are doing so at an average discharge walking speed of 2 ft/s, and average discharge SPPB score of 6/12, and an average 6MWT of around 425 feet. For gait speed and SPPB, we are just barely getting over those critical thresholds associated with reduced risk for adverse events. And for 6MWT, we are well below the published distance of 673 feet associated with community ambulation.[1]
Clinical Suggestions:
- Focus on the Intensity pillar of our Clinical Model from the very beginning.
- Each session in PT and OT, try to get the heart rate into the target training zone and do at least one activity to biomechanical failure.
- Trust that in doing the above, the improvement in function will follow.
- Using time effectively for Type 6 patients.
Our data show that only 25% of these patients discharge to home with over half discharging to either the hospital or to long-term care. And, on average, they make little to no improvement in self-care of basic mobility. Here are some ideas on how to raise the value of our care for these patients:
Clinical Suggestions:
- Focus on the Wellness & Prevention pillar of our Clinical Model from the very beginning.
- Start working on strategies for living at the patient’s evaluation level of physical ability from the very beginning. You can always shift gears if the patient improves.
- Begin caregiver training in the first week of care, even if you are still working out the details of the best transfer strategy.
- Work with the inter-professional team to watch for indications the patient may return to the hospital. Often, worsening of functional performance is an early indicator, so alert the team if this happens.
- Work with the inter-professional team to prepare the patient and family for discharge to a high level of care. Start this during the first week of care.
I hope you found this summary of our data interesting and helpful. The rich data set to which you all contribute is a treasure trove for learning as we take what we’ve seen and done and use that information to continually improve. This is just one of many ways we couple the best of science, with the art of caring.
[1] Porter ME. N Engl J Med 2010; 363:2477-2481.
[2] Fulk G et al. Stroke. 2017;48:406-411.


