By Patty Scheets, Vice President, Quality and Compliance
Note: a PDF download of this content is available at the end of this article.
About 10 years ago, we began our journey toward implementing evidence-based care, starting with a standardized approach to examining patient outcomes. In 2022 we separated our Information Technology services from Avamere Health Services which meant we lost our bridge to our data repository that is needed to visualize and study our data. Since that time, there have been many advances with data storage strategies, and earlier this year we selected a new data partner, Skypoint AI, who we believe can assist us in restoring our data dashboards and in moving toward integration of more sophisticated data approaches.
I’m pleased to share that we now have dashboards that let us know how we are doing collecting patient information and how we are doing with the actual clinical outcomes of our patients. Let’s take a closer look.
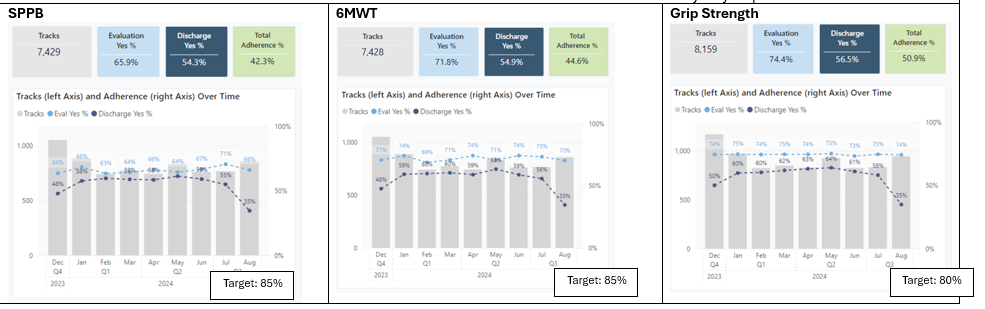
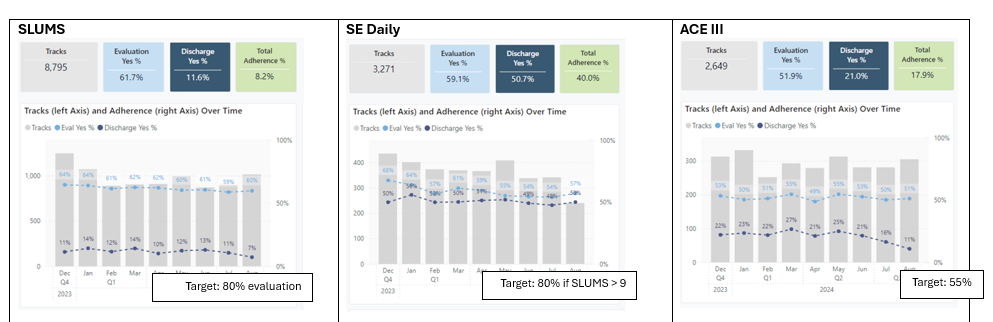
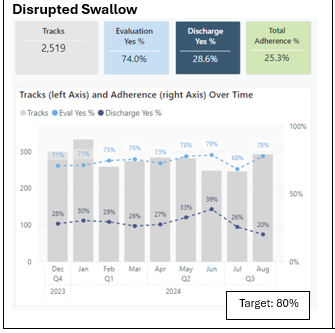
First, we measure our adherence to the data collection process. This is important because our goal is to measure all patients who meet the test criteria, not just a few. In the chart below, you can see that the percentage of patients for whom we collected data at evaluation is represented in a light blue line and box, and the percentage collected at discharge in a dark blue line/box. The specifics of which patients are included and our targets for each measure are included in the table below. Here’s the big takeaway, we are doing relatively well collecting data at evaluation with our overall adherence to the targets falling on average 15% lower than target. We are struggling more to get data collected at discharge without overall adherence to the targets falling on average 30-40% lower than target. Improving in adherence to data collection is one of our performance improvement projects as we close out 2024. Brainstorming barriers to data collection and solutions as a team might be the most effective strategy to move these metrics.
| Adherence to Data Collection
· Medicare part A (traditional or managed) · Excludes patients discharged to the hospital or expired |
· SPPB and 6MWT only for patients with goals for ambulation · SE Daily only for patients with a SLUMS score > 9 |
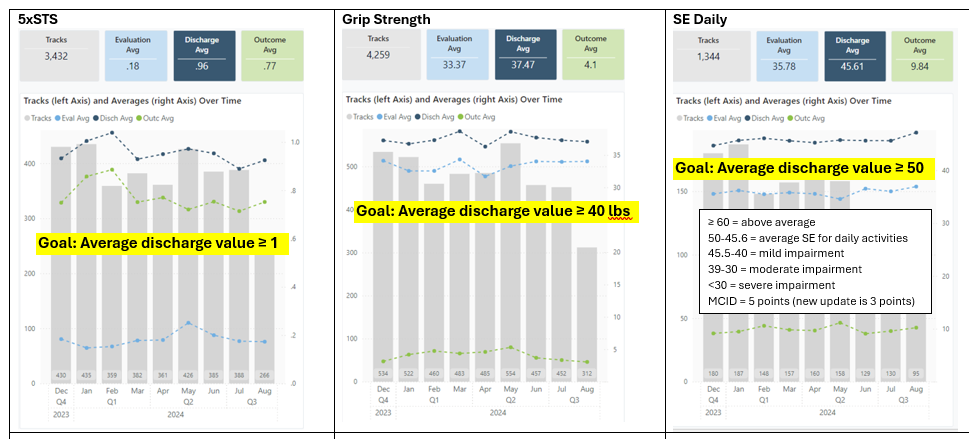
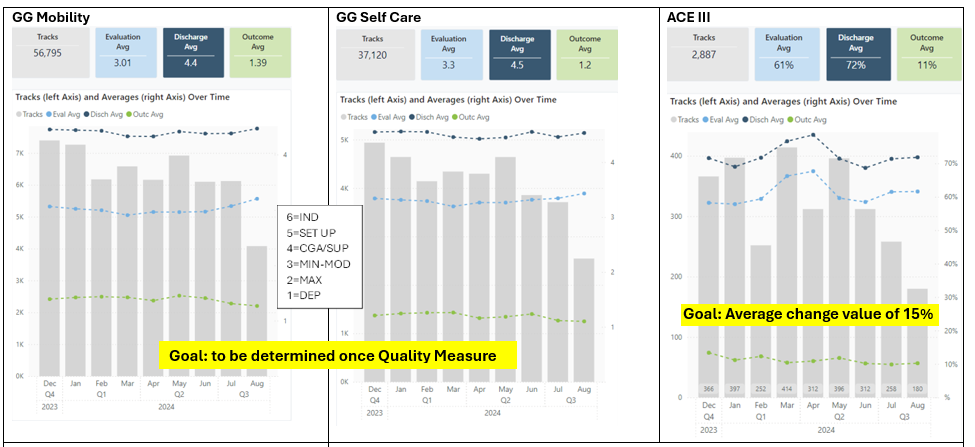
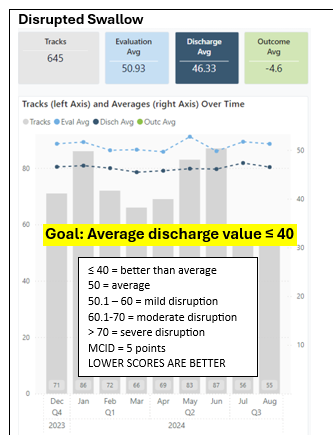
As we collect data, we begin examining it in light of critical thresholds identified in the literature and from our own internal data analytics. For most outcome measures, then, we are able to set targets for where, on average, we hope to get patients by discharge. These values relate not just to physical independence with basic activities, but also to critical thresholds that represent reduced risk of adverse events like falls, hospital admission, functional decline, and even mortality. See the table below for how we are currently doing with clinical outcomes and our targets for each measure. As you work with your Area Rehab Director and Direct, there are a few rules we use when considering how well a set of data represent overall care:
- The larger the number of patients (tracks) represented in the data set, the more confident you can be that the average data provided represents how you do with patients on average.
- If you have fewer than 50 patients (tracks) represented in the data set, individual patients who did really well or poorly can skew the average values. We recommend viewing data over a sufficiently long period of time to have at least 50 tracks represented in the data.
Only patients for whom we have evaluation and discharge data will be represented in the outcomes data. If you are struggling to get data collected, the patients represented may not be a good reflection of your clinical outcomes. Keep this in mind when you look at the following company data; our outcome data represent fewer than 50% of the selected subgroup of patients.
| Clinical Outcome Data
• Medicare part A (traditional or managed) • Excludes patients discharged to the hospital or expired |
• SPPB, gait speed, 5xSTS, and 6MWT only for patients with goals for ambulation
• SE Daily only for patients with a SLUMS score > 9 |
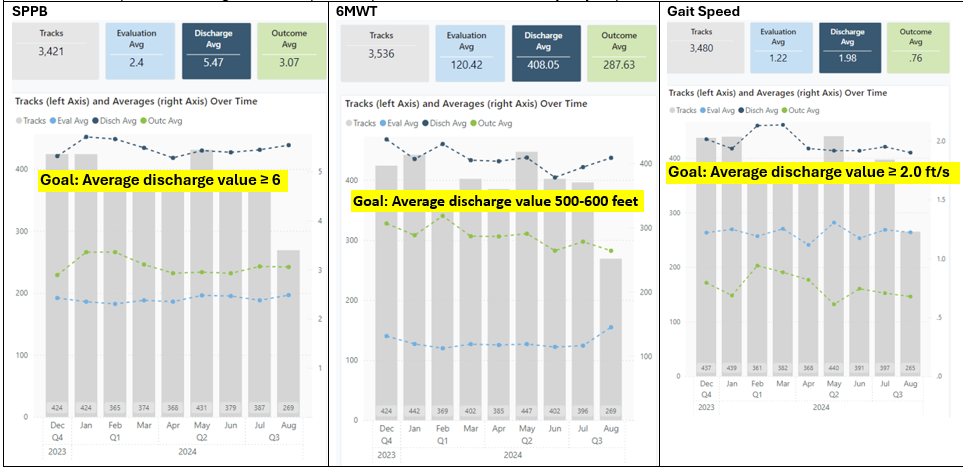
As you examine these data you can see that we have some opportunity to improve our data collection efforts, to use the data as critical markers in discharge planning, and for fine tuning our interventions to deliver maximum value to our patients and clients. But seeing in the data is the first step!
Please let us know what questions you may have as be continue on this journey.DOWNLOAD>> Clinical Outcome Data Oct 2024


")